These are the 3 core Search Campaigns needed when setting up Google Ads for your DTC brand.
| Campaign | Description |
|---|---|
| Branded Search | This campaign will target your brand keywords. |
| Generic Search | This campaign will target your top performing unbranded keywords |
| Keyword Prospecting | This will be a Dynamic Keyword campaign. The goal of this campaign is to find new profitable unbranded keywords. |
Common Settings
These settings will stay the same across all of your Campaigns.
| Setting | Value |
|---|---|
| Objective | Sales |
| Conversion Goal | Purchases |
| Campaign Type | Search |
| Campaign Goal Method | Website Visits |
| Networks: Choose Networks | Include Search Partners Exclude Google Display Network |
| Locations | Select your primary location |
Campaign:
Branded Search
This campaign targets your Branded search terms. It is mostly defensive in nature: It prevents your competitors from bidding on your brand term cost effectively. This campaign will generate the majority of your conversions, but you want to keep your cost-per-acquisition costs low, as most of the sales generated by this campaign are not incremental sales.
| Setting | Value |
|---|---|
| Campaign Name | Search: Brand |
| Bidding What do you want to focus on? Where do you want your ads to appear? Percent (%) impression share to target? Maximum CPC bid limit? | Impression Share Top of Results Page 90% $1.00 |
| Daily Budget | $20.00 / day (adjust to your level of comfort) |
Ad Groups
This campaign initially contains only two ad groups: One to target the exact match version of your brand name, and another to target the phrase match version.
| Ad Group Name | Keywords | Negatives |
|---|---|---|
| Brand – exact | Your primary brand term, exact match eg: [nike] | None |
| Brand – phrase | Your primary brand term plus product names closely related to your brand, phrase match eg: “nike”, “air jordan” | Exclude the exact match brand term, targeted in the “Brand – exact” ad group above. eg: [nike] |
Campaign:
Generic Search
This campaign will target high-performing non-branded search terms. It will initially be empty, but you will populate it as you discover high performing search terms.
| Setting | Value |
|---|---|
| Campaign Name | Search: Generic |
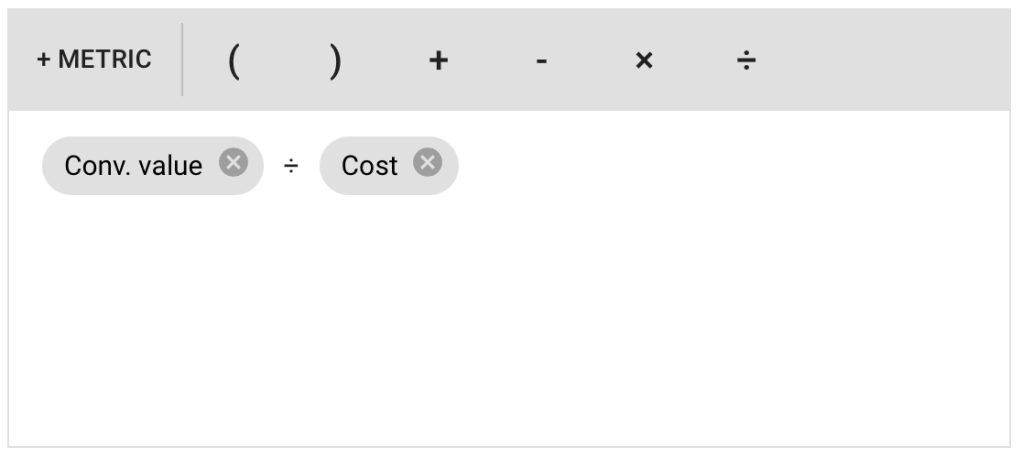
| Bidding What do you want to focus on? Set a target return on ad spend | Conversion Value 200% (adjust to your profit margins and comfort levels) |
| Daily Budget | $10.00 / day (adjust to your level of comfort) |
Eventually this campaign will contain one ad group for each performing exact match search term, as well as a second ad group with the phrase match version of the performing term.
Ad Groups
| Ad Group Name | Keywords | Negatives |
|---|---|---|
| Term A – exact | A high-performing generic term related to your brand, exact match eg: [running shoes] | None |
| Term A – phrase | A high-performing generic term related to your brand, phrase match eg: “running shoes” | Exclude the exact match term targeted by the ad group above. eg: [running shoes] |
| … | … | |
| Term X – exact | As you discover new performing keywords, create a new exact match ad group for them. eg: [basketball shoes] | None |
| Term X – phrase | Also create a phrase-match version of the ad group. eg: “basketball shoes” | Exclude the exact match term targeted by the ad group above. eg: [basketball shoes] |
Keyword Exclusions
Your Generic Search Campaign may target your Branded search terms. Create a Negative Keyword List containing your branded terms, and add it to the campaign to ensure this does not happen.
Campaign:
Keyword Prospecting
The goal of the Keyword Prospecting Campaign is to find new high performing keywords.
When such a keyword is found it should be:
- Added to the Generic Search Campaign
- Excluded from this Keyword Prospecting Campaign
| Setting | Value |
|---|---|
| Campaign Name | Search: Dynamic Prospecting |
| Bidding What do you want to focus on? Set a target cost per action? | Conversions No |
| Daily Budget | $10.00 / day (adjust to your level of comfort) |
Ad Groups
This campaign will have a single dynamic ad group called “Catch-all”, targeting all pages on the site.
| Ad Group Name | Ad Targets | Negatives |
|---|---|---|
| Catch-all [dynamic] | All Webpages | Exclude all keywords already targeted by your Generic Search Campaign. eg: [running shoes] [basketball shoes] |
Keyword Exclusions
This campaign will also target your Branded terms unless you explicitly exclude them. Create a Negative Keyword List containing your branded terms and add the list to the campaign.
Multi Country / Currency / Language
If you are targeting multiple countries, currencies, and languages, then you will generally want to replicate this campaign structure for each Currency x Language combination.